TRADING BOOM AND CRASH
STRATEGY 1 : MONEY MAKER
Before proceeding with this strategy please make sure to clear your trading chat and select the candlestick format.
Now input the following functions on your chat
-
Moving Average (EMA200)
-
Period: 2000
-
Shift: 0
-
Method: Exponential
-
Styles: Black, 2 pixel
-
2. Moving Average (EMA10)
1. Period: 10
2. Shift: 0
3. Method: Exponential
4. Styles: Blue, 1 pixel
3. Moving Average (EMA35)
1. Period: 35
2. Shift: 0
3. Method: Exponential
4. Styles: Yellow, 2 pixel
4. Bollinger Bands
1. Period: 20
2. Deviation: 2000
3. Apply: Close
4. Styles: Green, 1 pixel
HOW TO SETUP THE BOOM AND CRASH STRATEGY
Now let mark mark the spike points on chart across all time frames, will start with day time frame.
1. Change your time frame to Daily, Use a straight line to mark the following
a. Ema 200
b. Ema 35
c. Ema 10
*** This is a very critical Step***
2. Change your time frame to H4, Use a straight line to mark the following
a. Ema 200
b. Ema 35
c. Ema 10
3. Change the time frame to H1, Use a straight line to mark the following
a. Ema 200
b. Ema 35
** Note Ema 10 is not important here**
4. Change the time frame to M30 and M15 respectively and mark the following
a. Ema 200 Only
** As for M5 and M1 you can mark them but they are not reliable in terms of spiking accurancy
HOW THE MONEY MAKER STRATEGY WORKS
You should now be able to see all the lines you added to the chart. The money maker strategy is independent, but you can combine it with other strategies I will share with you.
Next, switch the time frame to M15, which is the ideal time frame for both volatility indices and forex, so we will use this one.
The lines on your chart (representing the EMAs) mark the points where you will place buy orders for Booms and sell orders for Crashes. It’s important to pay close attention to these points.
These lines represent areas with a high probability of spikes (Booms and Crashes). By plotting them on your chart, you eliminate the need to scan all time frames each time you want to trade, saving you time and ensuring you don’t miss entries on other time frames while focusing on one.
Let’s get started now.
MONEY MAKER GUIDELINES
-
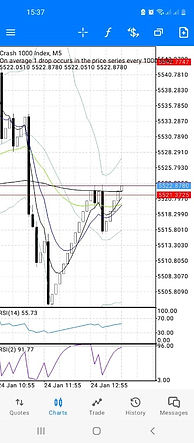
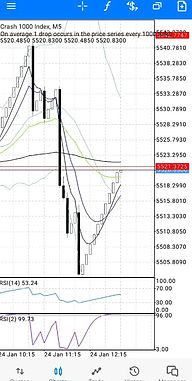
As the trend (Boom/Crash) approaches any of the straight lines on your chart, check the different time frames to identify where the line is coming from (e.g., Day, H4). If the line originates from the weekly or daily time frame (either EMAs), there’s a high probability of larger spikes, ranging from 30 to 50 pips, along with consecutive spikes in that zone. This is a good opportunity to consider increasing your lot size and holding positions longer. For H4/H1 time frames, expect spikes in the range of 20-30 pips. I challenge you to backtest this and let me know if I’m wrong. The images below show what you’ve been missing. Let’s move forward.
-
Scan all time frames on your chart to find areas where the Exponential Moving Averages (EMAs) align. For example, if the EMA 200 on H1 is near the same point as EMA 10 on D1, they don’t need to be exactly at the same point, but within 5-10 pips of each other. This zone typically generates large and consecutive spikes, averaging 20-30 pips. Always scan for this pattern, as it happens frequently across all time frames. Make sure to update your EMA markings daily before trading.
-
Always prioritize the EMAs on higher time frames, as they tend to produce larger spikes and form consolidation zones filled with spikes. These lines act as critical support and resistance zones. DO NOT trade against the spikes in these zones. Booms and Crashes are highly volatile in support and resistance areas. EMA 200 is KING—this is something you’ll discover with time.
-
On a bullish day, Crash 1000, Crash 500, and Crash 300 tend to exceed the spike zone by about 5-10 pips, while Boom indices are typically more accurate. For a bearish day, the reverse is true: Crashes tend to surpass the spike zone, and Boom indices may miss the spike zone by 5-15 pips. Keep this in mind when calculating your risk. Avoid overtrading—spikes usually respect a zone 2-3 times before breaking through. Overtrading can erode your gains.
-
Spikes usually respect a particular EMA for 2-3 instances before breaking. For example, if a pair spikes at EMA 35 or EMA 10, it’s likely to spike again when it reaches that EMA level. This tends to happen 2-3 times, as shown in the chart below.
-
Take breaks between trades, ideally 30 to 45 minutes. Boom and Crash tend to show one pair spiking while others are moving steadily for 15-20 minutes. Taking consecutive trades during this period can put you in a challenging position.
-
Take the time to review both your profitable and losing trades across all time frames. You may spot patterns or trends that can improve your trading approach. Thank you.
*** Please share our link on social media and will soon have trading lessons and Q & A sessions***
For more clarity contact us at: https://t.me/VolatilityAdmin
Lets move on to Strategy 2